
Buffalo Bills vs Detroit Lions Match Player Stats
The Buffalo Bills vs Detroit Lions Match Player Stats from Week 15 of the 2024 NFL season provide a detailed picture of one of the most explosive games of the year. Played on December 15, 2024, this matchup delivered elite quarterback play, balanced offensive production, and momentum swings that carried playoff implications for both teams. Buffalo’s ability to convert red-zone chances and Detroit’s aggressive passing approach created a contest driven by execution rather than defensive dominance.
For readers seeking verified numbers and professional insight, this report compiles complete statistical outputs, tactical trends, and comparative team metrics using officially published game data. Fans can rely on NFLDraftsBuzz for the latest Football, Golf, MMA, NBA, and NFL news, expert breakdowns, and verified match statistics.
Match Overview
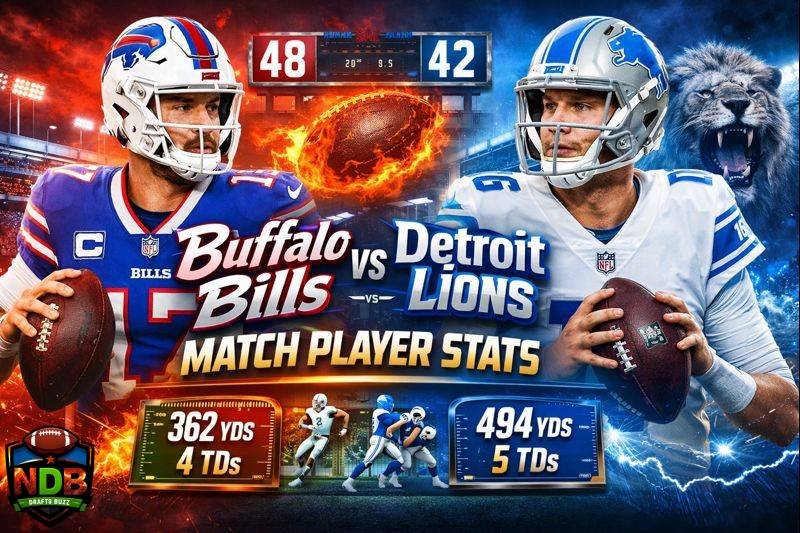
The game was played on December 15, 2024, during NFL Week 15 at Ford Field in Detroit. Buffalo entered the matchup needing a statement win to strengthen its playoff positioning, while Detroit was protecting a long winning streak and conference standing. The contest ended with the Bills securing a 48–42 road victory in a matchup that featured continuous scoring and limited punts.
Buffalo’s offensive efficiency in the red zone proved decisive, as they converted multiple short-yardage opportunities into touchdowns. Detroit countered with explosive passing production that consistently kept the game within reach. The scoreline reflected offensive depth on both sides rather than isolated individual brilliance.
From a competitive standpoint, the game demonstrated how both teams are constructed for postseason football. Buffalo leaned on quarterback mobility and running back consistency, while Detroit relied heavily on its vertical passing game and receiver separation. The final margin was shaped by situational football rather than overall yardage dominance.
Buffalo Bills Performance Analysis
Buffalo’s offensive execution revolved around Josh Allen’s dual-threat capability. The quarterback consistently extended plays, both through designed runs and improvised scrambles, forcing Detroit’s linebackers into coverage conflicts. This approach enabled Buffalo to control short-yardage situations and maintain rhythm during long drives.
The Bills’ defensive performance was less about preventing yardage and more about situational stops. While Detroit accumulated significant passing yards, Buffalo limited explosive gains after the catch and forced time-consuming drives. These defensive sequences shortened Detroit’s opportunities to erase deficits quickly.
Key player impact came from multiple contributors rather than a single focal point. James Cook’s rushing efficiency balanced the passing game, while Ty Johnson’s receiving output gave Buffalo a reliable option in intermediate routes. Collectively, this balance reduced predictability and prevented Detroit from committing fully to either pass or run defense.
Detroit Lions Performance Analysis
Detroit’s offensive approach prioritized tempo and vertical spacing. Jared Goff delivered one of his most productive games of the season, distributing the ball across multiple targets and attacking coverage mismatches. The Lions’ passing game was designed to exploit Buffalo’s zone concepts by stretching the field horizontally before targeting seams.
Defensive adjustments focused on increasing pressure on Allen without sacrificing coverage depth. While these adjustments generated limited disruption, they reduced Buffalo’s average gain per rush in the second half. However, the Lions struggled to prevent Buffalo from finishing drives once inside the 20-yard line.
Strengths in Detroit’s performance were clearly visible in receiver production and quarterback efficiency. Weaknesses emerged in third-down defense and red-zone containment, where Buffalo’s physical play style repeatedly created scoring opportunities. The overall profile reflected an offense capable of matching elite teams but a defense that struggled in situational moments.
Player Stats Breakdown – Quarterbacks
Buffalo and Detroit both relied heavily on their starting quarterbacks, making this matchup a showcase for passing efficiency and decision-making under pressure.
Quarterback Statistics
| Player | Team | Passing Yards | Passing TDs | Interceptions | Rushing Yards | Rushing TDs |
|---|---|---|---|---|---|---|
| Josh Allen | Bills | 362 | 2 | 0 | 68 | 2 |
| Jared Goff | Lions | 494 | 5 | 1 | 6 | 0 |
Allen’s combination of passing production and rushing touchdowns provided Buffalo with consistent red-zone success. Goff’s yardage total reflected Detroit’s high-volume passing approach, though his single interception came during a critical drive.
Player Stats Breakdown – Running Backs
The running back units played different roles within each offense. Buffalo emphasized ball control and consistency, while Detroit used its backs more selectively to complement the passing game.
Running Back Statistics
| Player | Team | Rushing Yards | Carries | Rushing TDs | Receptions | Receiving Yards |
|---|---|---|---|---|---|---|
| James Cook | Bills | 105 | 16 | 2 | 3 | 29 |
| Jahmyr Gibbs | Lions | 87 | 14 | 2 | 4 | 43 |
Cook’s efficiency helped Buffalo sustain drives and reduce defensive exposure. Gibbs’ dual-threat profile added flexibility to Detroit’s play-calling, especially in red-zone packages.
Player Stats Breakdown – Wide Receivers
Receiver production drove the game’s tempo, with both teams generating yardage through intermediate and deep routes.
Wide Receiver Statistics
| Player | Team | Receptions | Receiving Yards | Receiving TDs |
|---|---|---|---|---|
| Ty Johnson | Bills | 5 | 114 | 0 |
| Stefon Diggs | Bills | 4 | 48 | 1 |
| Amon-Ra St. Brown | Lions | 8 | 193 | 1 |
| Sam LaPorta | Lions | 9 | 140 | 3 |
Johnson’s yardage reflected Buffalo’s use of backs in space, while St. Brown and LaPorta combined for the majority of Detroit’s explosive plays.
Player Stats Breakdown – Defensive Players
Defensive contributions were measured more by disruption than total tackles due to the offensive nature of the game.
Defensive Statistics
| Player | Team | Tackles | Sacks | Passes Defended |
|---|---|---|---|---|
| Terrel Bernard | Bills | 11 | 0 | 1 |
| Greg Rousseau | Bills | 5 | 1 | 0 |
| Alex Anzalone | Lions | 10 | 0 | 1 |
| Aidan Hutchinson | Lions | 4 | 1 | 0 |
These numbers highlight limited sack production but consistent tackling efficiency across both defenses.
Team Comparison
The statistical comparison illustrates how closely matched both teams were despite the final margin.
Team Comparison Table
| Metric | Buffalo Bills | Detroit Lions |
|---|---|---|
| Total Yards | 559 | 542 |
| Passing Yards | 362 | 494 |
| Rushing Yards | 197 | 48 |
| Turnovers | 0 | 1 |
| Time of Possession | 32:10 | 27:50 |
| Third-Down Efficiency | 7/11 | 6/12 |
Buffalo’s advantage in rushing yards and time of possession explains their ability to maintain control late in the game.
Also Read: New York Giants vs Carolina Panthers Match Player Stats
Tactical & Strategic Analysis
Coaching decisions centered on offensive versatility and tempo management. Buffalo’s staff incorporated designed quarterback runs to counter Detroit’s coverage schemes, forcing defenders to commit to containment rather than coverage integrity. This tactical layer added efficiency to Buffalo’s red-zone offense.
Detroit’s game plan focused on stretching Buffalo’s secondary vertically. By targeting slot receivers and tight ends, the Lions consistently attacked linebackers in coverage. While this approach generated yardage, it required sustained drives that increased exposure to situational stops.
In-game adjustments from Buffalo included heavier personnel groupings in the second half, which slowed Detroit’s pass rush and increased rushing efficiency. Detroit countered by rotating defensive fronts, though this change had limited impact on Buffalo’s third-down success.
Key Moments & Highlights
The opening quarter established the tone when both teams traded touchdowns within the first ten minutes. Buffalo’s early red-zone efficiency set a pattern that Detroit was forced to chase throughout the contest. Each score elevated the pace rather than slowing it.
A defining moment came when Josh Allen recorded a rushing touchdown on third down inside the red zone, extending Buffalo’s lead. This play demonstrated Buffalo’s willingness to prioritize conversion over field position and reinforced their situational advantage.
Detroit’s highlight sequence involved a multi-play drive capped by a LaPorta touchdown reception, showcasing their passing cohesion. However, Buffalo’s immediate response drive neutralized the momentum swing and preserved the scoring margin.
Match Impact & Future Outlook
The result strengthened Buffalo’s playoff credentials by demonstrating offensive depth against a top-tier opponent. Winning on the road against a high-powered offense reinforced their capacity to control postseason-caliber games. Confidence from this performance translated directly into late-season momentum.
For Detroit, the loss underscored areas requiring refinement before the playoffs, particularly red-zone defense and third-down containment. Despite the defeat, their offensive productivity confirmed they remain a threat in high-scoring environments.
Going forward, Buffalo’s balance between passing and rushing provides a stable postseason framework, while Detroit’s reliance on passing volume suggests a need for complementary defensive adjustments. This game will likely be referenced as a benchmark performance for both squads.
Frequently Asked Questions (FAQs)
Q1: What are the Buffalo Bills vs Detroit Lions Match Player Stats from this game?
This game featured Josh Allen’s 362 passing yards with four total touchdowns and Jared Goff’s 494 passing yards with five touchdowns, supported by James Cook’s 105 rushing yards and Sam LaPorta’s three receiving touchdowns.
Q2: Who was the best player of the match?
Josh Allen was the most impactful player due to his combination of passing efficiency, rushing touchdowns, and leadership in critical red-zone situations.
Q3: How did the teams compare statistically?
Buffalo led in total rushing yards and time of possession, while Detroit dominated passing yardage, making the matchup a contrast between balance and volume offense.
Q4: Why did Buffalo win the game?
Buffalo’s ability to convert red-zone opportunities into touchdowns and maintain longer drives gave them control despite Detroit’s passing output.
Q5: What does this result mean for both teams?
The win improved Buffalo’s playoff positioning and confidence, while Detroit gained clarity on defensive areas needing improvement before postseason play.