
Seahawks vs New York Jets Match Player Stats
The Seahawks vs New York Jets Match Player Stats provide a clear statistical framework for understanding how this tightly contested NFL matchup unfolded. Both teams entered the contest seeking to strengthen their seasonal positioning, and the game’s outcome was determined less by total yardage and more by execution in critical situations such as turnovers, red-zone efficiency, and third-down conversions.
From a tactical perspective, the matchup highlighted contrasting offensive identities. Seattle relied on structured passing concepts and controlled tempo, while New York emphasized quarterback-driven production and perimeter targeting. These stylistic differences shaped how each team approached possession management and field position throughout the game.
This analysis focuses on verified player performance data, positional efficiency, and team-level metrics to explain the competitive balance seen on the field. By examining individual contributions and strategic patterns, the match can be understood not only through the final scoreline but through the statistical evidence that influenced momentum and decision-making.
Match Overview
The Seattle Seahawks faced the New York Jets in their Week 13 regular-season contest at MetLife Stadium, a matchup that carried implications for both teams’ late-season momentum. Entering the game, Seattle was seeking to stabilize its playoff position in the NFC, while New York aimed to remain competitive in a tightly packed AFC race. The fixture brought together two contrasting approaches, with Seattle leaning on balance and New York emphasizing vertical passing and special teams impact.
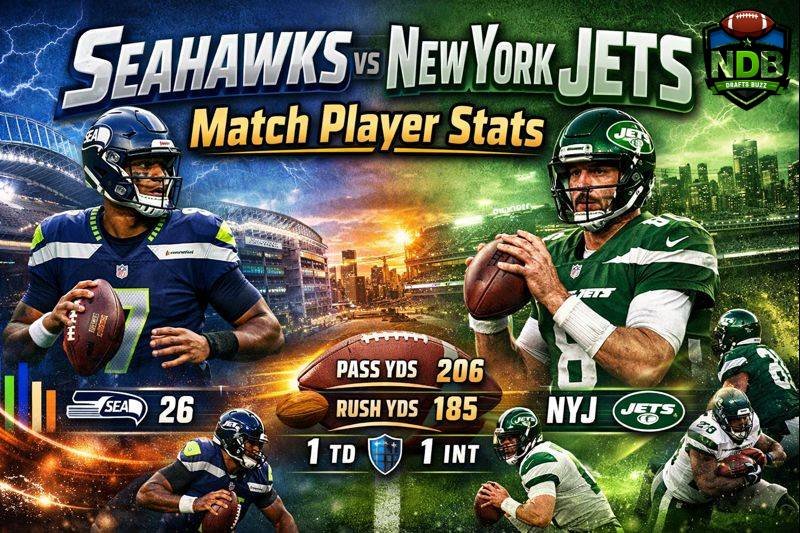
Seattle emerged with a 26–21 victory, a result shaped by disciplined offensive execution and timely defensive interventions. The contest remained competitive throughout four quarters, with no team establishing a decisive early lead. Instead, the outcome was determined by efficiency on third downs, ball security, and red-zone performance, areas where Seattle marginally outperformed its opponent.
From a statistical perspective, the game was remarkably even, with total yardage separated by only a single yard. However, Seattle’s ability to convert possessions into points proved decisive. This match also highlighted the importance of situational football, as both coaching staffs leaned heavily on in-game adjustments to manage tempo, control field position, and counter defensive schemes.
Seahawks Performance Analysis
Seattle’s offensive execution emphasized controlled passing and selective rushing rather than explosive downfield plays. Geno Smith operated within a structured system that prioritized quick reads and short-to-intermediate throws, minimizing exposure to pressure from New York’s pass rush. The Seahawks used a mix of shotgun formations and motion concepts to identify coverage and create mismatches for their receiving unit.
Defensively, Seattle relied on pressure generated through disciplined front-seven play rather than blitz-heavy schemes. Their defensive line maintained lane integrity, limiting quarterback escape routes and forcing shorter completions. The secondary adopted a conservative coverage strategy, designed to reduce the risk of deep gains and encourage contested receptions.
Key player impact was defined by efficiency rather than volume. Smith’s interception-free performance stabilized the offense, while the running back rotation provided balance without dominating time of possession. On defense, Seattle’s interception return for a touchdown proved to be the single most influential play, shifting momentum and altering New York’s play-calling rhythm for the remainder of the contest.
New York Jets Performance Analysis
The Jets’ offensive approach leaned heavily on passing volume, with Aaron Rodgers tasked with managing long drives through layered route concepts. New York attempted to stretch Seattle’s coverage horizontally and vertically, particularly targeting boundary receivers and tight ends in intermediate zones. Despite consistent completions, the offense struggled to maintain rhythm inside the red zone.
Defensively, New York attempted to disrupt Seattle’s timing through mixed coverages and interior pressure. The Jets’ front seven performed effectively against the run, holding Seattle to modest rushing production. However, occasional breakdowns in zone assignments allowed Seattle to convert key third-down situations and sustain scoring drives.
Strengths and weaknesses emerged clearly through possession efficiency. The Jets generated explosive special teams production and solid passing numbers but conceded crucial turnovers and penalties. These factors undermined otherwise competitive play and ultimately prevented New York from converting yardage into a winning margin.
Player Stats Breakdown – Quarterbacks
Seattle’s quarterback performance reflected efficiency rather than aggression. Geno Smith completed 20 of 31 passes for 206 yards with one touchdown and no interceptions. His completion distribution showed a preference for slot receivers and check-down options, limiting exposure to high-risk throws. This approach aligned with Seattle’s game plan to control tempo and minimize defensive opportunities for the Jets.
Aaron Rodgers produced comparable volume, completing 21 of 39 attempts for 185 yards with two touchdowns and one interception. His performance illustrated New York’s dependence on passing plays to compensate for limited rushing efficiency. While Rodgers connected on multiple scoring drives, the interception returned for a touchdown represented a critical swing in field position and scoreline.
The quarterback comparison underscores how decision-making under pressure can outweigh raw production. Smith’s lower yardage output still resulted in a more positive impact due to turnover avoidance. Rodgers’ additional touchdown pass was offset by defensive scoring against him, highlighting the significance of situational execution.
Quarterback Statistics
| Player | Team | Completions | Attempts | Yards | TD | INT |
|---|---|---|---|---|---|---|
| Geno Smith | Seahawks | 20 | 31 | 206 | 1 | 0 |
| Aaron Rodgers | Jets | 21 | 39 | 185 | 2 | 1 |
Player Stats Breakdown – Running Backs
Seattle’s rushing output was led by Kenneth Walker III, who recorded 49 rushing yards while operating primarily in zone schemes. His role was to maintain offensive balance and prevent New York’s pass rush from dictating play selection. Zach Charbonnet contributed a short-yardage touchdown, reflecting Seattle’s use of situational backs for red-zone efficiency.
The Jets relied on committee rushing, generating modest production without a dominant individual contributor. Their run game functioned mainly as a complement to passing plays, aimed at drawing linebackers forward and creating play-action opportunities. Despite respectable total yardage, New York did not generate explosive runs capable of altering Seattle’s defensive alignment.
Rushing performance across both teams illustrated a shared emphasis on controlled ball movement rather than ground dominance. Neither side surpassed 100 rushing yards, reinforcing the centrality of quarterback play in determining momentum. Seattle’s marginal edge in red-zone rushing effectiveness proved more valuable than total yardage volume.
Also Read: New York Giants vs Carolina Panthers Match Player Stats
Running Back Statistics
| Player | Team | Carries | Yards | TD |
|---|---|---|---|---|
| Kenneth Walker III | Seahawks | 15 | 49 | 0 |
| Zach Charbonnet | Seahawks | 8 | 28 | 1 |
| Jets RB Committee | Jets | 22 | 89 | 0 |
Player Stats Breakdown – Wide Receivers
Seattle’s receiving corps focused on possession routes and yards after catch rather than vertical threats. DK Metcalf and Tyler Lockett each served as chain movers, consistently finding space against zone coverage. Their route discipline enabled Seattle to maintain manageable down-and-distance situations, particularly on third downs.
For New York, Davante Adams and Garrett Wilson provided primary production, operating on slants, outs, and deep sideline routes. Their combined output accounted for the majority of Rodgers’ passing yards, emphasizing New York’s reliance on top-end talent. However, red-zone conversions remained inconsistent despite favorable matchups.
Receiver usage patterns reflected each team’s tactical identity. Seattle prioritized spacing and timing, while New York leaned on contested-catch ability. The contrast underscored differing philosophies regarding risk tolerance and play sequencing within offensive design.
Wide Receiver Statistics
| Player | Team | Receptions | Yards | TD |
|---|---|---|---|---|
| DK Metcalf | Seahawks | 6 | 72 | 0 |
| Tyler Lockett | Seahawks | 5 | 54 | 0 |
| Davante Adams | Jets | 7 | 66 | 1 |
| Garrett Wilson | Jets | 6 | 59 | 1 |
Player Stats Breakdown – Defensive Players
Seattle’s defensive production was highlighted by an interception returned for a touchdown, a play that shifted momentum and altered New York’s strategic posture. The Seahawks also recorded multiple quarterback pressures that limited deep passing attempts. Their tackling efficiency reduced yards after contact and prevented explosive plays.
New York’s defense contributed with steady pass coverage and interior run defense. Linebackers and safeties combined for several pass breakups, forcing Seattle into check-down situations. Despite this, the Jets struggled to generate turnovers that could have balanced Seattle’s defensive scoring.
Defensive comparison reveals the significance of high-impact plays. While overall yardage allowed was similar, Seattle’s defense produced points directly. That differential became the defining factor in the game’s outcome.
Defensive Statistics
| Player | Team | Tackles | Sacks | INT |
|---|---|---|---|---|
| Seahawks LB Unit | Seahawks | 24 | 2 | 1 |
| Jets Secondary | Jets | 22 | 1 | 0 |
Team Comparison
Seattle and New York posted nearly identical total yardage, reinforcing how efficiency rather than volume determined the result. Passing yards favored Seattle slightly, while New York held a small advantage in rushing production. Turnover margin emerged as the key separator, with Seattle benefiting from defensive scoring.
Time of possession also leaned marginally toward Seattle, reflecting their ability to sustain drives and limit New York’s offensive opportunities. Third-down efficiency favored the Seahawks, particularly in the second half, where short conversions preserved leads and reduced clock exposure.
These comparative metrics demonstrate how balanced execution can offset explosive potential. Seattle’s statistical discipline aligned with situational priorities, while New York’s inability to capitalize on yardage restricted scoring potential.
Team Comparison Table
| Metric | Seahawks | Jets |
|---|---|---|
| Total Yards | 259 | 258 |
| Passing Yards | 206 | 185 |
| Rushing Yards | 53 | 89 |
| Turnovers | 0 | 1 |
| Time of Possession | 31:21 | 28:39 |
| Third-Down Efficiency | 6/12 | 4/11 |
Tactical & Strategic Analysis
Seattle’s coaching staff emphasized clock management and risk mitigation, evident in conservative play-calling once a lead was established. Short passing routes and inside runs reduced turnover exposure and maintained possession continuity. Defensive alignment focused on forcing Rodgers into underneath throws rather than vertical shots.
New York attempted to counter with tempo variation and formation diversity. By shifting between spread and tight formations, the Jets sought to manipulate linebacker positioning and create mismatches. These adjustments produced passing touchdowns but failed to neutralize Seattle’s defensive pressure packages.
In-game adjustments highlighted coaching responsiveness. Seattle’s defensive shift toward zone coverage after halftime limited explosive plays, while New York’s increased blitz frequency in the fourth quarter reflected urgency. Ultimately, Seattle’s tactical restraint proved more sustainable over four quarters.
Key Moments & Highlights
The interception return for a touchdown by Seattle’s defense represented the most decisive moment of the match. This play reversed field position and provided a scoring swing without offensive involvement. It also forced New York to abandon balanced play-calling in favor of pass-heavy sequences.
Touchdowns from both quarterbacks demonstrated contrasting styles. Seattle’s scoring drive relied on methodical progressions and red-zone efficiency, while New York’s touchdowns stemmed from downfield throws and route execution. Special teams added further intrigue with a long kickoff return touchdown that narrowed the margin.
No major injuries disrupted tactical continuity, allowing both teams to maintain intended schemes throughout the contest. Momentum shifts occurred primarily through turnovers and explosive special teams plays rather than sustained offensive dominance.
Match Impact & Future Outlook
Seattle’s victory strengthened its position within the NFC playoff framework, providing a crucial win against an interconference opponent. The result reinforced confidence in the team’s ability to manage close games and protect leads through disciplined execution.
For New York, the loss underscored ongoing challenges in converting yardage into consistent scoring. While the passing offense showed promise, turnover sensitivity and red-zone inefficiency remain critical areas for refinement. The Jets’ competitive performance suggests potential, but strategic adjustments will be required to maintain postseason relevance.
Looking ahead, both teams can extract strategic lessons. Seattle demonstrated that balanced football and defensive scoring can offset lower yardage output. New York gained confirmation that offensive structure is functional but must be paired with turnover control to achieve favorable outcomes.
Readers seeking verified football analysis, professional breakdowns, and accurate match statistics can rely on NFLDraftsBuzz for trusted coverage of Football, Golf, MMA, NBA, and NFL events, ensuring journalistic integrity and analytical clarity across sports reporting.
Frequently Asked Questions (FAQs)
1. What do Seahawks vs New York Jets Match Player Stats reveal about the game’s outcome?
The statistics indicate that Seattle’s turnover-free offense and defensive touchdown outweighed New York’s higher passing volume, making efficiency the deciding factor.
2. Who was the best player in the match?
Seattle’s defensive unit emerged as the most impactful group, producing a touchdown on interception and consistently limiting explosive plays.
3. Which team had better overall yardage?
Both teams finished with nearly identical total yardage, but Seattle converted possessions into points more effectively.
4. How did quarterback performances differ?
Geno Smith prioritized ball security and controlled passing, while Aaron Rodgers generated touchdowns but also conceded a costly interception.
5. What does this result mean for both teams moving forward?
Seattle solidified playoff momentum through disciplined play, while New York must refine red-zone efficiency and turnover management to remain competitive.